Abstract
Reverberation chamber (RC) is a new testing environment in the field of electromagnetic compatibility measurement. Compared with the traditional testing environments, the RC has obvious advantages in improving testing efficiency and generating high E-field strength with relatively low input power. However, there are inconsistent problems in the test results of the radiation sensitivity threshold of the equipment in the reverberation chamber and the uniform field environment obtained by using the test methods in the current standards. Therefore, studying the equivalence of radiation sensitivity thresholds between the two has become a hot issue at present. Since most frequency-using devices in the electromagnetic environment can be equivalent to an antenna, in this paper, the dipole antenna under the compound field of the boundary deformation reverberation chamber and the uniform field of the anechoic chamber (AC) is taken as the research object to study the equivalence of antenna coupling power under these two conditions. Firstly, the coupling models in the anechoic chamber and reverberation chamber environments were established. The formulas for the antenna coupling power and the spatial radiation field strength under different radiation conditions were derived, and the power correlation coefficients of the two under the same sensitivity threshold were obtained. Subsequently, the electromagnetic environment of the reverberation chamber was constructed by using the Monte Carlo method, and the influence law of random plane waves with different column numbers on the coupling power of the antenna was simulated and analyzed. Finally, the equivalence factor of the coupling power of the two when the threshold of the radiation sensitivity test is the same in the reverberation chamber and the anechoic chamber is obtained.
Keywords
Reverberation Chamber, Plane Wave Irradiation, Uniform Field, Sensitivity Threshold, Equivalent Test
1. Introduction
With the rapid advancement of information technology, the level of electronation in weapon systems has been continuously improved. According to statistical data from the U.S. military, the proportion of electronic equipment in the cost of various weaponry is as follows: 35% of the cost of aircraft is for electronic equipment, 45% of the cost of missiles is for electronic equipment, and as high as 88% of the cost of command-and-control systems is for electronic equipment
| [1] | Shen G Q, Zheng D, Wang Y B. A review of research on adaptability standards for complex electromagnetic environments at home and abroad[J]. Environmental Technology, 2019(S2): 19-26. |
[1]
. Although the increase in electronation has significantly enhanced the performance and combat effectiveness of weaponry, it has also made this equipment more dependent on the electromagnetic environment and much more sensitive to electromagnetic interference (EMI). In battlefield environments, intense electromagnetic fields generated by radars, communication systems, and television transmission towers often cause electronic and electrical equipment or systems to malfunction, resulting in performance degradation or even damage, which may lead to serious accidents or disasters. For example, during the Russia-Ukraine conflict, the Russian military used electronic warfare systems to counter the precision-guided munitions launched by the Ukrainian military. The hit rate of the Ukrainian "Excalibur" guided projectiles dropped sharply to less than 10%, and the Ukrainian military was eventually forced to abandon the use of these projectiles. Some electronic equipment of the Chinese military have also been frequently affected by strong electromagnetic environments during tests and exercises, leading to accidents and disrupting the normal progress of exercises
| [2] | Sun G Z, Liu S H, Chen J P, et al. The impact of battlefield electromagnetic environment effects on information warfare[J]. Military Operations Research and Systems Engineering, 2006, 20(3): 43-47. |
| [3] | Mandeep K, Shikha K, Danvir M. Electromagnetic interference[J]. IEEE Transactions on Electromagnetic Compatibility, 2011, 3(11): 1-5. https://doi.org/10.1109/ICECTECH.2011.5941844 |
[2, 3]
. This indicates that the electromagnetic interference resistance of some electronic equipment of the Chinese military needs to be enhanced. Therefore, before weaponry is finalized, delivered from the factory, and put into use, electromagnetic performance testing must be conducted to improve its anti-interference capability and ensure its stability and adaptability in battlefield electromagnetic environments, especially in strong electromagnetic fields.
Electromagnetic Environmental Effects (E3) Test is usually conducted in anechoic chambers or open fields using direct electromagnetic wave irradiation to evaluate its electromagnetic radiation sensitivity. However, common Electromagnetic Compatibility (EMC) testing sites such as open fields, TEM cells, GTEM cells, and anechoic chambers have limitations: they can only simulate a single electromagnetic field environment with specific radiation directions and polarization angles, and cannot simulate the complex electromagnetic environment formed by multiple reflections of electromagnetic waves in cabins. For electronic systems installed in various shielded cabins, such as UAV data link systems and navigation systems, their operating environment is a cabin electromagnetic environment, which is characterized by uneven spatial distribution of the electromagnetic field, random polarization modes, and the difficulty in accurately quantifying the electric field distribution, which is due to internal loads and body boundaries. It is unscientific and inaccurate to use traditional test methods based on continuous wave direct irradiation in open fields or shielded rooms for their electromagnetic radiation sensitivity testing.
As a new type of testing site, the reverberation chamber has the following advantages: high quality factor (Q-factor), enabling the acquisition of high field strength in a large test space with relatively low input power (saving power amplifier costs), generating a statistically uniform and randomly polarized field, and eliminating the need to rotate the equipment under test (EUT), thus saving test time. In view of the advantages of the reverberation chamber method in simulating the in-cabin electromagnetic environment, GJB151B-2013 classifies the reverberation chamber method as an alternative method for radiation sensitivity testing. However, there is an inconsistency in the equipment radiation sensitivity test results between the reverberation chamber and the uniform field environment
| [4] | GB/T 17626.21-2015 Electromagnetic compatibility - Testing and measurement techniques - Mixed wave chamber test method[S]. |
| [5] | Kan D P, Jia C X. Difference analysis between radiation sensitivity test based on reverberation chamber and anechoic chamber related test[C]// [Virtual Test and Total Comprehensive Test Verification Technology]. 2014: 521-523. |
[4, 5]
.
2. Literature Review
Therefore, the research on the correlation of equipment E3 tests between reverberation chamber and anechoic chamber environments has long been a hot topic at home and abroad. In 1999, John M. Ladbury et al. conducted a theoretical comparison between the power received by an antenna in the reverberation chamber and that in the anechoic chamber in their literature and analyzed the ratio of the power received by an antenna when the average electric field in the reverberation chamber is equal to that in the anechoic chamber. This ratio is related to the number of independent stirs (n) in the reverberation chamber and the directivity coefficient of the EUT in the anechoic chamber
| [6] | Ladbury J M, Koepke G H. Reverberation chamber relationships: corrections and improvements or three wrongs can (almost) make a right[C]//1999 IEEE International Symposium on Electromagnetic Compatibility. Piscataway: IEEE, 1999: 1-6. https://doi.org/10.1109/ISEMC.1999.812857 |
[6]
; In 2003, L. Musso et al. studied the repeatability of radiation immunity tests in reverberation chambers. Immunity tests were conducted in three reverberation chambers of different sizes, and it was found that the test repeatability in reverberation chambers was good. The test data from the three reverberation chambers were compared and analyzed with those from the anechoic chamber. They also studied the correlation formula based on the characteristics of the maximum field and concluded that the correlation is related to the ratio of the maximum power to the average power in the reverberation chamber
| [7] | Musso L, Canavero F, Demoulin B, et al. Radiated immunity testing of a device with an external wire: repeatability of reverberation chamber results and correlation with anechoic chamber results[C]//Proceedings of the IEEE International Symposium on Electromagnetic Compatibility. 2003, 2: 828-833. https://doi.org/10.1109/ISEMC.2003.1236715 |
[7]
; In 2005, Roberto De Leo et al. compared the reverberation chamber test results when the number of independent samples was 8 and 150, respectively. They believed that a larger number of independent samples makes it easier to approach the true sensitivity value. They also compared the reverberation chamber test results with 150 independent samples and the anechoic chamber test results when the directivity coefficient of the EUT was 1, and found that there was a 2 dB difference between the reverberation chamber method and the anechoic chamber method. They also emphasized the importance of the EUT's directivity coefficient in the anechoic chamber
| [8] | De Leo R, Mariani Primiani V. Radiated Immunity Tests: Reverberation Chamber vs. Anechoic Chamber Results [J]. IEEE Transactions on Electromagnetic Compatibility, 2005. https://doi.org/10.1109/IMTC.2005.1604130 |
[8]
; In 2006, Craig W. Fanning conducted reverberation chamber and anechoic chamber immunity tests on automobiles in accordance with different test standards (GMW3097, MIL-STD-461E, ISO11452-2). He found that the test results of the two chambers (reverberation chamber and anechoic chamber) were inconsistent, with differences of approximately 1.5 dB between the results obtained in accordance with different standards. He also verified through experiments that the installation of a ground plane in the reverberation chamber does not affect the correlation between the two tests
| [9] | Fanning C W. Achieving correlation of radiated rf immunity testing performed in an absorber lined shielded enclosure and a mode tuned reverberation chamber[J]. IEEE Transactions on Electromagnetic Compatibility, 2006.
https://doi.org/10.1109/ISEMC.2006.1706423 |
[9]
; In 2012, Christo Tsigros et al. analyzed the use of source stirring mode and frequency stirring mode for immunity tests in reverberation chambers. Tests were conducted using source stirring modes (one with an antenna array and the other with a moving antenna), and the results were compared with those of immunity tests in the anechoic chamber. It was found that the test results under the two source stirring modes were in good agreement, and when the test results under the two source stirring modes were compared with those of immunity tests in the anechoic chamber, the results were more consistent at low frequencies (800-1600 MHz) but showed larger differences at high frequencies
| [10] | Tsigros C, Piette M, Vandenbosch G A E, et al. Radiated Immunity in Reverberation and Semianechoic Rooms: Conditions for Equivalence[J]. IEEE Transactions on Electromagnetic Compatibility, 2012 (Volume: 55, Issue: 2): [Page(s): 222 - 230]. https://doi.org/10.1109/TEMC.2012.2219869 |
[10]
; In 2013, Emmanuel Amador et al. proposed a new test method and used it to conduct immunity tests in a reverberation chamber and a GTEM cell. The test results showed that the sensitivity of the equipment obtained in accordance with the IEC6100-4-21 standard fluctuated significantly, while the results obtained using the proposed method were in good agreement with those from the GTEM cell
| [11] | Amador E, Krauthäuser H, Besnier P. A Binomial Model for Radiated Immunity Measurements[J]. IEEE Transactions on Electromagnetic Compatibility, 2013, 55(4): 683-691.
https://doi.org/10.1109/TEMC.2012.2231942 |
[11]
; In 2014, Emmanuel Amador et al. compared the immunity test results of the reverberation chamber method and the anechoic chamber method based on previously described methods. They concluded that the immunity test results of the EUT obtained by the reverberation chamber method would be in good agreement with those obtained by the anechoic chamber method only when the electrical size and complexity of the EUT meet certain requirements; if the electrical size or complexity does not meet the requirements, the test results between the two methods would deviate significantly
| [12] | Amador E, Miry C, Bouyge N. Compatible susceptibility measurements in fully anechoic room and reverberation chamber[J]. [2014 International Symposium on Electromagnetic Compatibility], 2014.
https://doi.org/10.1109/EMCEurope.2014.6931024 |
[12]
.
Domestic research on the correlation of E3 test results between the reverberation chamber and the anechoic chamber environments is relatively limited, and the existing literature only qualitatively analyzes the reasons for the differences based on experimental results. In 2008, Wang Xiangdong only proposed a possible solution in his literature: first, establish circuit models for different types of tested equipment to study the correlation between radiation immunity tests, and then identify the laws of correlation between the two radiation immunity tests through experiments
| [13] | Wang X D, Wei M, Hu M S. Study on correlation between reverberation chamber and traditional immunity test methods[J]. Equipment Environmental Engineering, 2008, 5(3): 50-53. |
[13]
; In 2010, Jia Rui conducted research on the correlation of radiation immunity tests between reverberation chambers and GTEM cells, and used the Pearson product-moment correlation coefficient (a measure of linear correlation) to evaluate the correlation of the radiation immunity test results between them, indicating that the test results of the reverberation chamber were in good correlation with those of the GTEM cell
; In 2012, Zhang Bo et al. showed through experiments that the immunity test results of the reverberation chamber and the anechoic chamber were in good agreement without any conversion
| [15] | Zhang B, Yuan Z Y, He J L. Comparison on the test results between reverberation chamber and anechoic chamber[J]. IEEE Transactions on Electromagnetic Compatibility, 2012: 1-4. https://doi.org/10.1109/APEMC.2012.6237860 |
[15]
; In 2013, Liu Xinyuan et al. found through experiments that the minimum sensitivity threshold of the equipment measured at different sampling points at each test frequency was close to the sensitivity threshold measured under open field conditions
; In 2014, Kan Depeng, Jia Cuixia, et al. presented the test results under the two conditions and analyzed that the main reason for the differences in the test results was that the field in the reverberation chamber is statistical and discrete, with no temporal accumulation, while the field in the anechoic chamber is applied continuously, with temporal accumulation
| [17] | Kan D P, Jia C X. Difference analysis between radiation sensitivity test based on mixed wave chamber and anechoic chamber related test[C]//Virtual Test and Total Comprehensive Test Verification Technology. 2011(2): 61-64. |
[17]
; In 2015, Wei Guanghui, Liu Xinyuan, Sun Yongwei, et al. conducted correlation research on the test results of the reverberation chamber and the anechoic chamber in their literature and found that the correlation was good when the minimum or average value of the sensitivity threshold was taken as the research object, but poor when the maximum value was taken
| [18] | Wei G H, Liu X Y, Sun Y W, et al. Research on Correlation of Electromagnetic Radiation Susceptibility for Radio Fuze in Uniform Field and Reverberation Chamber [J]. High Voltage Engineering, 2015(41): [287-293].
https://doi.org/10.13336/j.1003-6520.hve.2015.01.040 |
[18]
; In 2015, Wang Rongsheng conducted sensitivity tests in the reverberation chamber with different numbers of independent samples and compared the sensitivity results with those from the anechoic chamber. He believed that the sensitivity value from the reverberation chamber test was lower than that from the anechoic chamber test, and the magnitude of the difference was related to the number of independent samples (N) used in the reverberation chamber, the frequency (f), and the directivity coefficient (D) of the EUT
.
Summarizing the above research status at home and abroad, the theoretical analysis on the correlation of equipment E3 tests between reverberation chamber and anechoic chamber environments is mainly concentrated abroad. However, to date, theory cannot be applied to resolve the differences between the two tests. The reason is that the correlation analysis of the two tests is not yet mature, and there are still undetermined unknown factors that require further research.
Based on previous domestic and international research, this paper addresses the current situation where the electromagnetic environmental effect sensitivity thresholds differ between reverberation chambers and anechoic chambers. Taking the UAV data link under the composite field of a reverberation chamber with boundary deformation and the uniform field of an anechoic chamber as the research object, this study investigates the equivalence of coupled power under these two conditions. Firstly, coupled models for the anechoic chamber and reverberation chamber environments were established, and formulas for the relationship between coupled power and spatial radiated field strength under different radiation conditions were derived, yielding the power correlation coefficient when the sensitivity thresholds of the two environments are consistent. Subsequently, the Monte Carlo method was used to construct a simulated electromagnetic environment for the reverberation chamber, and simulation analysis was conducted to explore the influence law of random plane waves with different numbers of columns on coupled power. Finally, the equivalence factor of coupled power between the reverberation chamber and the anechoic chamber was obtained under the condition that the thresholds of radiation sensitivity tests conducted in the two chambers are consistent. Among the research contents, an innovative equivalent test method for equipment sensitivity thresholds under plane wave irradiation in a reverberation chamber is proposed. For the first time, the correlation coefficient of equipment sensitivity thresholds between reverberation chamber and anechoic chamber environments was theoretically derived, simulated, calculated, and verified, with further validation through experiments. This research outcome holds significant importance for future equipment EMC testing.
3. Coupling Models Established
In the anechoic chamber and reverberation chamber, the equipment sensitivity threshold is determined by the magnitude of the coupling power when the equipment is interfered with. Therefore, to establish the equipment coupling models under the two conditions, it is first necessary to determine the relationship between the equipment coupling power and the field strength at its location. Since equipment in this environment can be equivalent to a monopole antenna, an antenna coupling model is used here for equivalent analysis.
3.1. Coupling Law of Monopole Antennas in Anechoic Chamber Environment
Under the irradiation of a uniform plane wave with electric field

, the received power of the antenna is:
(1)
3.2. Coupling Law of Monopole Antennas in Reverberation Chamber Environment
Under Reverberation Chamber condition, the relationship between the field strength in the reverberation chamber and the received power of the EUT is
| [20] | Peng Z Q, Zhou X. Analysis of the Relation of Radiated Immunity Tests between Reverberation Chamber and Anechoic Chamber[D]. Nanjing: Southeast University, China, 2017. |
[20]
:
where

is the maximum value of *;

is the received power at the sensitive port of the EUT in the reverberation chamber; and

is the rectangular components of the electric field in the reverberation chamber.
From Equations (
1) and (
2), the relationship between the received power of the antenna in the reverberation chamber and that in the anechoic chamber can be derived:
The antenna radiation sensitivity is an inherent property of the antenna itself. When the radiation sensitivity test levels of the reverberation chamber and the anechoic chamber are consistent, i.e.

, the ratio of the received power of the antenna in the reverberation chamber to that in the anechoic chamber is:
From Equation (
4), it can be seen that if the directivity coefficient
D(f) and polarization matching factor
p of the equipment in the anechoic chamber are known, the above equation can be determined. In the anechoic chamber environment, the polarization direction of the coupled electromagnetic wave of the equipment is generally kept consistent with that of the transmitting antenna; therefore,
p=1.
4. Simulation Analysis
Based on the above modeling analysis, we will verify the theoretical calculation results through simulation. This paper uses the plane wave superposition method to construct a reverberation chamber test field environment, which eliminates the need for modeling and simulation of the reverberation chamber and thus avoids the technical problem of huge simulation computation. Following this idea, this paper starts from the plane spectrum and analyzes the method of setting the parameters of the superimposed plane wave based on the specific ideal reverberation chamber field environment. On this basis, the coupling power of the tested equipment (EUT) under the uniform field in the anechoic chamber and the composite field in the reverberation chamber is calculated jointly by using Matlab and FEKO software. Finally, the correlation between the sensitivity thresholds of the reverberation chamber and the anechoic chamber is obtained when the radiation sensitivity test level (i.e., internal electric field strength) is consistent.
4.1. The Directional Coefficient of the Tested Equipment Simulation
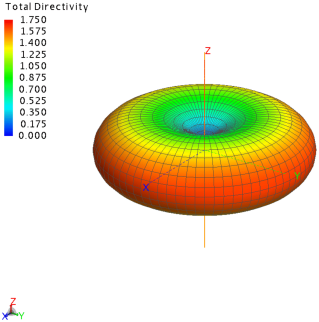
Equipment in electromagnetic sensitivity testing environments will couple energy from the surrounding electromagnetic field, so this type of coupling device can be equivalent to a receiving antenna, and a dipole antenna is the most common type of antenna used in such studies. For the convenience of research and analysis, we take the half-wave dipole as an example to simulate and analyze the radiation sensitivity threshold of the EUT. For a half-wave dipole antenna, its radiation pattern in free space is shown in
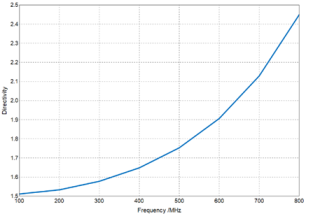
Figure 1, and the relationship between its maximum directivity coefficient
D(f) and frequency is shown in
Figure 2. The center frequency of antenna is 400MHz, with a frequency range of 100-800MHz.
Figure 1. 3D-Radiation Pattern of Dipole Antenna.
Figure 2. Dipole Antenna D (f) vs. Frequency f.
4.2. Equipment Radiation Sensitivity Simulation in Anechoic Chamber
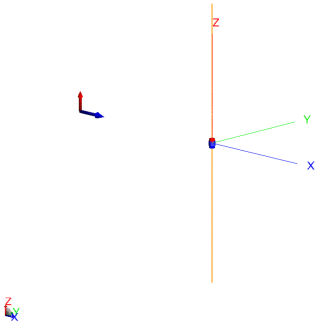
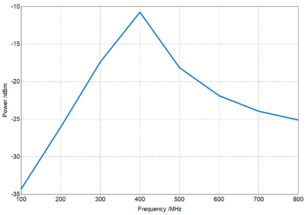
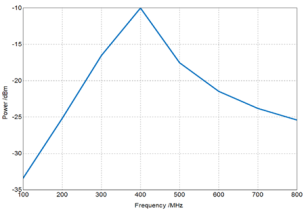
In an anechoic chamber, electromagnetic waves are uniformly distributed, so the simulation of the radiation sensitivity threshold of the EUT in the anechoic chamber can be regarded as simulating the coupling energy of the EUT under the uniform irradiation of a single plane wave in space. Due to the EUT being equivalent to a dipole antenna, the simulation model of the dipole antenna under single-wave irradiation is shown in
Figure 3, and the relationship between its coupling power
P(f) and frequency
f in the 100-800MHz frequency band is shown in
Figure 4.
Figure 3. Simulation Model.
Figure 4. Coupling Power P (f) vs. Frequency f.
4.3. Equipment Radiation Sensitivity Simulation in Reverberation Chamber
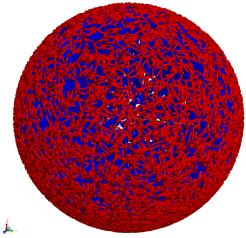
As mentioned earlier, the construction of the electromagnetic environment in a reverberation chamber can be achieved by superimposing multiple columns of plane waves. The incident direction, polarization angle, and phase of these plane waves exhibit a random distribution in space. This paper uses the FEKO full-wave simulation module and Matlab for Monte Carlo simulation to simulate the electromagnetic environment of a reverberation chamber. Matlab controls the uniform and random distribution of parameters of multiple columns of plane waves, and through multiple cyclic superposition, simulates the spatial distribution of electromagnetic waves in the final reverberation chamber, which are statistically uniform, isotropic, and randomly polarized.
Figure 5 shows a 10000-column free random plane wave superposition model, where the blue arrow represents the direction of plane wave incidence and the red arrow corresponds to the polarization direction. The relationship between the EUT’s coupling power
P(f) and frequency
f in the 100-800 MHz frequency band is shown in
Figure 6.
Figure 5. 10000 column free random plane wave superposition model.
Figure 6. Coupling Power P (f) vs. Frequency f.
4.4. The Equivalent Correlation between the Sensitivity Thresholds of the AC and RC
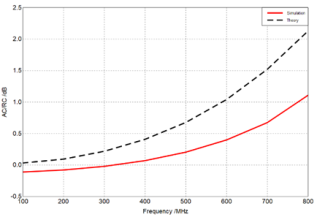
We compared the coupling power obtained from the anechoic chamber and the reverberation chamber, and obtained the correlation coefficient
K(f) as a function of frequency, as shown in the red curve of
Figure 7. It can be seen that the directional coefficient curve calculated earlier has the same trend of change as the correlation coefficient
K (f), while the black curve is the theoretical calculation result from the previous part.
Figure 7. The Correlation Coefficient K (f) between the two (Theoretic vs. Simulation Results).
5. Experimental Analysis
In the experimental analysis of the anechoic chamber and reverberation chamber, the equipment sensitivity threshold is still determined by the magnitude of the coupling power when the equipment is interfered with. Therefore, in the experiment, we first measured the coupling power of the equipment and the corresponding field strength at its location to verify the previously established coupling models. Since the tested equipment can be equivalent to a monopole antenna, the antenna coupling model was used to assist in analyzing the experimental results.
5.1. Equipment Sensitivity Test in Anechoic Chamber
The data link airborne antenna and coaxial connecting cable were used as the tested equipment and placed on the anechoic chamber test bench for the experiment. The transmitting antenna was placed in a horizontal polarization mode, 1 m above the ground and 1 m away from the tested antenna. A field strength measuring device was placed adjacent to the tested antenna to record the field strength value at that location, which is the field strength value at the tested antenna. Additionally, a current measuring device was used to measure the induced current of the tested antenna. A 50 Ω through-type load, an attenuator, and the transmitting end of the photoelectric conversion device were wrapped with a shielding cloth with excellent shielding effectiveness to reduce measurement errors and improve the accuracy of the load-induced current measurement. During the test, the tested antenna was irradiated in the direction of the strongest coupling, and the lock-loss threshold and critical interference field strength at each frequency point were recorded in detail.
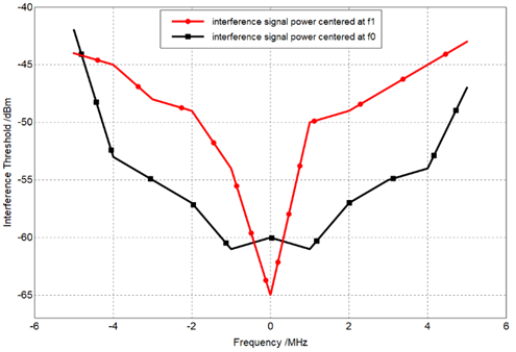
When the operating signal strength of the data link equipment was -80 dBm, interference was applied to the data link equipment within the frequency bands centered at f0 and f1 with a bandwidth of 10 MHz. When the data link experienced lock loss, the received power at its sensitive port and the measured electric field strength were shown in
Table 1.
Table 1. Out-of-lock Threshold and Critical Interference Field Strength of Data Link Equipment Under Continuous Wave Interference.
f/ MHz | P/ dBm | E/ (mV·m-1) |
f0-5 | -42.19 | 68.1 |
f0-4 | -52.45 | 20.9 |
f0-3 | -54.86 | 15.8 |
f0-2 | -57.11 | 12.2 |
f0-1 | -60.35 | 8.4 |
f0 | -59.57 | 9.2 |
f0+1 | -60.26 | 8.5 |
f0+2 | -57.26 | 12 |
f0+3 | -55.05 | 15.5 |
f0+4 | -54.61 | 16.3 |
f0+5 | -48.18 | 34.2 |
f/ MHz | P/ dBm | E/ (mV·m-1) |
f1-5 | -44 | 55.3 |
f1-4 | -45.1 | 48.7 |
f1-3 | -47.9 | 35.3 |
f1-2 | -49.5 | 29.3 |
f1-1 | -53.7 | 18.1 |
f1 | -65.2 | 4.8 |
f1+1 | -50.5 | 26.2 |
f1+2 | -48.8 | 31.8 |
f1+3 | -46.4 | 41.9 |
f1+4 | -44.7 | 51 |
f1+5 | -43.1 | 61.3 |
Figure 8. CW-interfered Data Link Device Lockout Threshold in the Sensitive Frequency Band.
5.2. Equivalent Test Method in Reverberation Chamber
The statistical results of the data link sensitivity threshold when the number of steps of the reverberation chamber was 36 and the number of tests was 50 are shown in
Table 2. It can be seen from the table that the sensitivity threshold of the data link system changes during each test. When the operating frequency was
f0, the number of times the error between the data link's sensitive field strength threshold under reverberation chamber conditions and that under uniform field conditions was within 3 dB was 48, accounting for 96%. When the operating frequency was
f1, the number of such cases was 46, accounting for 92%. The test results are relatively close to the theoretical analysis results, indicating that setting the number of steps of the reverberation chamber to 36 is reasonable when the test error between the reverberation chamber and the anechoic chamber is within 3 dB.
Table 2. The Sensitivity Threshold of the Data Link in the Reverberation Chamber and Its Correlation Coefficient(K) with that in the Anechoic Chamber.
i–th Test | Interference Wave Frequency f0-5/MHz | Interference Wave Frequency f1+5/MHz |
P/dBm | E/(mV·m-1) | K/dB | P/dBm | E/(mV·m-1) | K/dB |
1 | -28.81 | 64.25 | -0.51 | -27.71 | 55.95 | -0.79 |
2 | -27.71 | 72.92 | 0.59 | -29.45 | 45.81 | -2.53 |
3 | -29.20 | 61.38 | -0.90 | -29.47 | 45.70 | -2.55 |
4 | -31.18 | 48.91 | -2.87 | -28.19 | 52.99 | -1.27 |
5 | -29.60 | 58.65 | -1.30 | -28.30 | 52.27 | -1.38 |
6 | -30.36 | 53.74 | -2.06 | -26.97 | 60.92 | -0.05 |
7 | -25.46 | 94.46 | 2.84 | -26.73 | 62.66 | 0.19 |
8 | -25.52 | 93.77 | 2.78 | -29.56 | 45.22 | -2.64 |
9 | -25.72 | 91.67 | 2.58 | -26.46 | 64.66 | 0.46 |
10 | -27.49 | 74.76 | 0.81 | -28.26 | 52.56 | -1.34 |
11 | -30.50 | 52.86 | -2.20 | -28.93 | 48.64 | -2.01 |
12 | -30.27 | 54.30 | -1.97 | -25.14 | 75.23 | 1.78 |
13 | -26.79 | 81.00 | 1.51 | -29.51 | 45.48 | -2.59 |
14 | -31.16 | 49.02 | -2.86 | -30.08 | 42.63 | -3.15 |
15 | -29.78 | 57.41 | -1.48 | -29.30 | 46.61 | -2.38 |
16 | -28.97 | 63.06 | -0.67 | -26.73 | 62.65 | 0.19 |
17 | -26.24 | 86.36 | 2.06 | -26.55 | 63.99 | 0.37 |
18 | -29.05 | 62.46 | -0.75 | -25.68 | 70.72 | 1.24 |
19 | -28.80 | 64.26 | -0.50 | -24.30 | 82.93 | 2.63 |
20 | -30.65 | 51.96 | -2.35 | -29.77 | 44.16 | -2.85 |
21 | -29.14 | 61.81 | -0.84 | -27.10 | 60.04 | -0.18 |
22 | -30.06 | 55.63 | -1.76 | -27.48 | 57.46 | -0.56 |
23 | -29.23 | 61.18 | -0.93 | -29.13 | 47.52 | -2.21 |
24 | -26.02 | 88.52 | 2.28 | -25.55 | 71.78 | 1.37 |
25 | -29.71 | 57.88 | -1.41 | -25.16 | 75.04 | 1.76 |
26 | -26.69 | 81.95 | 1.61 | -25.74 | 70.26 | 1.18 |
27 | -29.59 | 58.73 | -1.29 | -24.81 | 78.15 | 2.11 |
28 | -29.71 | 57.92 | -1.41 | -26.87 | 61.68 | 0.05 |
29 | -25.30 | 96.25 | 3.01 | -26.98 | 60.87 | -0.06 |
30 | -25.83 | 90.55 | 2.47 | -23.96 | 86.15 | 2.96 |
31 | -30.47 | 53.07 | -2.17 | -29.52 | 45.42 | -2.60 |
32 | -30.80 | 51.07 | -2.50 | -26.75 | 62.49 | 0.17 |
33 | -30.67 | 51.87 | -2.36 | -27.81 | 55.31 | -0.89 |
34 | -29.91 | 56.59 | -1.61 | -29.04 | 48.02 | -2.12 |
35 | -29.46 | 59.62 | -1.16 | -24.73 | 78.84 | 2.19 |
36 | -28.60 | 65.80 | -0.30 | -24.52 | 80.80 | 2.40 |
37 | -27.30 | 76.42 | 1.00 | -23.89 | 86.88 | 3.03 |
38 | -31.32 | 48.11 | -3.02 | -28.56 | 50.77 | -1.64 |
39 | -27.18 | 77.47 | 1.12 | -28.83 | 49.21 | -1.91 |
40 | -29.85 | 56.97 | -1.55 | -25.78 | 69.86 | 1.14 |
41 | -26.68 | 82.03 | 1.62 | -28.62 | 50.42 | -1.70 |
42 | -28.53 | 66.35 | -0.23 | -28.79 | 49.44 | -1.87 |
43 | -26.88 | 80.18 | 1.42 | -23.75 | 88.27 | 3.17 |
44 | -28.72 | 64.88 | -0.42 | -26.23 | 66.40 | 0.69 |
45 | -26.99 | 79.17 | 1.31 | -28.04 | 53.88 | -1.12 |
46 | -27.23 | 77.05 | 1.07 | -26.00 | 68.13 | 0.92 |
47 | -29.99 | 56.05 | -1.69 | -26.58 | 63.77 | 0.34 |
48 | -26.71 | 81.76 | 1.59 | -26.72 | 62.71 | 0.20 |
49 | -26.14 | 87.31 | 2.16 | -29.98 | 43.11 | -3.06 |
50 | -30.32 | 53.98 | -2.02 | -26.75 | 62.52 | 0.17 |
5.3. Correlation Analysis of Sensitivity Thresholds
To study the correlation of electromagnetic radiation sensitivity, the data in
Table 1 and
Table 2 were integrated into
Table 3 during data processing. Then, the maximum value and average value of the data link equipment's sensitivity threshold in the reverberation chamber and the sensitivity threshold of the data link equipment in the anechoic chamber were listed.
The interference threshold of the data link equipment in the anechoic chamber was compared with the maximum value and average value of the data link equipment's sensitivity threshold in the reverberation chamber. Software tools were used for calculation and analysis to determine the Pearson product-moment correlation coefficient, which was used to judge the degree of linear correlation between the two sensitivity tests.
Table 3. The Maximum Value of the Data Link Sensitivity Threshold in the RC and the AC.
Frequency | Maximum Value of the Sensitivity Threshold | Correlation Coefficient |
RC | AC |
f0 | 96.25 | 68.1 | 0.991 |
f1 | 88.27 | 61.3 |
The correlation coefficient between the data link sensitivity thresholds in the reverberation chamber and the anechoic chamber is close to 1, indicating that the two have a good linear correlation at the operating frequencies f0 and f1.
6. Recommendations
Through the preceding theoretical modeling, simulation analysis, and test design, the rationality of establishing the correlation model for equipment sensitivity thresholds in reverberation chambers and anechoic chambers under plane wave irradiation conditions, as well as the scientific validity of the derivation of the coefficient formulas, have been well verified. In the test analysis section, due to the failure to consider the impact of changes in the size of frequency-dependent equipment on the equivalence of sensitivity threshold test results between reverberation chambers and anechoic chambers, and the limitation of testing only the sensitive frequency band (200 MHz ~ 2 GHz) related to the antenna and cable coupling of the tested data link system, further research is required to determine whether the proposed model and formulas are applicable to larger equipment and higher frequency bands.
7. Conclusions
This paper takes a certain type of data link equipment as the test object. Based on the relationship between the coupling power and field strength of frequency-using equipment under the uniform field of the anechoic chamber and the reverberation chamber environment, it studies the sensitivity equivalence of typical frequency-using equipment under the reverberation chamber and uniform field conditions. A method for calculating the sensitivity threshold of frequency-using equipment and a sensitivity test method under reverberation chamber conditions are proposed, and the effectiveness of the method is verified through experiments, it can be concluded that:
1) The sensitivity thresholds of frequency-dependent equipment in anechoic chambers and reverberation chambers with consistent test environment levels (same electric field strength E) show a strong correlation, which provides a basis for equivalence analysis under reverberation chamber conditions.
2) The correlation coefficient K(f) between the two is only related to the directional coefficient D(f) of the EUT and has a proportional relationship.
3) For the equipment under test (EUT) with a low directivity factor, such as the UAV data link system in this test (D(f) ≤ 3), the difference between the test results in the anechoic chamber and the reverberation chamber is within 3 dB. This also serves as the basis for using the sensitivity threshold results obtained in the reverberation chamber to replace those obtained in the anechoic chamber when testing EUTs with low directivity factors.
The research findings of this paper hold strong application prospects in practical EMC testing. They can be used to reduce testing costs, improve testing efficiency, and provide an effective solution for the testing of equipment in complex high-field electromagnetic environments.
Abbreviations
E3 | Electromagnetic Environmental Effects |
RC | Reverberation chamber |
AC | Anechoic Chamber |
EMC | Electromagnetic Compatibility |
Conflicts of Interest
The authors declare no conflicts of interest.
References
| [1] |
Shen G Q, Zheng D, Wang Y B. A review of research on adaptability standards for complex electromagnetic environments at home and abroad[J]. Environmental Technology, 2019(S2): 19-26.
|
| [2] |
Sun G Z, Liu S H, Chen J P, et al. The impact of battlefield electromagnetic environment effects on information warfare[J]. Military Operations Research and Systems Engineering, 2006, 20(3): 43-47.
|
| [3] |
Mandeep K, Shikha K, Danvir M. Electromagnetic interference[J]. IEEE Transactions on Electromagnetic Compatibility, 2011, 3(11): 1-5.
https://doi.org/10.1109/ICECTECH.2011.5941844
|
| [4] |
GB/T 17626.21-2015 Electromagnetic compatibility - Testing and measurement techniques - Mixed wave chamber test method[S].
|
| [5] |
Kan D P, Jia C X. Difference analysis between radiation sensitivity test based on reverberation chamber and anechoic chamber related test[C]// [Virtual Test and Total Comprehensive Test Verification Technology]. 2014: 521-523.
|
| [6] |
Ladbury J M, Koepke G H. Reverberation chamber relationships: corrections and improvements or three wrongs can (almost) make a right[C]//1999 IEEE International Symposium on Electromagnetic Compatibility. Piscataway: IEEE, 1999: 1-6.
https://doi.org/10.1109/ISEMC.1999.812857
|
| [7] |
Musso L, Canavero F, Demoulin B, et al. Radiated immunity testing of a device with an external wire: repeatability of reverberation chamber results and correlation with anechoic chamber results[C]//Proceedings of the IEEE International Symposium on Electromagnetic Compatibility. 2003, 2: 828-833.
https://doi.org/10.1109/ISEMC.2003.1236715
|
| [8] |
De Leo R, Mariani Primiani V. Radiated Immunity Tests: Reverberation Chamber vs. Anechoic Chamber Results [J]. IEEE Transactions on Electromagnetic Compatibility, 2005.
https://doi.org/10.1109/IMTC.2005.1604130
|
| [9] |
Fanning C W. Achieving correlation of radiated rf immunity testing performed in an absorber lined shielded enclosure and a mode tuned reverberation chamber[J]. IEEE Transactions on Electromagnetic Compatibility, 2006.
https://doi.org/10.1109/ISEMC.2006.1706423
|
| [10] |
Tsigros C, Piette M, Vandenbosch G A E, et al. Radiated Immunity in Reverberation and Semianechoic Rooms: Conditions for Equivalence[J]. IEEE Transactions on Electromagnetic Compatibility, 2012 (Volume: 55, Issue: 2): [Page(s): 222 - 230].
https://doi.org/10.1109/TEMC.2012.2219869
|
| [11] |
Amador E, Krauthäuser H, Besnier P. A Binomial Model for Radiated Immunity Measurements[J]. IEEE Transactions on Electromagnetic Compatibility, 2013, 55(4): 683-691.
https://doi.org/10.1109/TEMC.2012.2231942
|
| [12] |
Amador E, Miry C, Bouyge N. Compatible susceptibility measurements in fully anechoic room and reverberation chamber[J]. [2014 International Symposium on Electromagnetic Compatibility], 2014.
https://doi.org/10.1109/EMCEurope.2014.6931024
|
| [13] |
Wang X D, Wei M, Hu M S. Study on correlation between reverberation chamber and traditional immunity test methods[J]. Equipment Environmental Engineering, 2008, 5(3): 50-53.
|
| [14] |
Jia R, Wang Q G. Correlation of radiation immunity tests in mixed wave chamber and GTEM chamber[J]. Journal of Hebei Normal University (Natural Science Edition), 2010(34): [676-679,685].
https://doi.org/10.13763/j.cnki.jhebnu.nse.2010.06.020
|
| [15] |
Zhang B, Yuan Z Y, He J L. Comparison on the test results between reverberation chamber and anechoic chamber[J]. IEEE Transactions on Electromagnetic Compatibility, 2012: 1-4.
https://doi.org/10.1109/APEMC.2012.6237860
|
| [16] |
Liu X Y, Wei G H, Sun Y W, et al. Study on sensitivity test method of radio fuze under reverberation chamber condition[J]. Journal of Microwaves, 2013, 29(4): 7-11.
https://doi.org/10.14183/j.cnki.1005-6122.2013.04.011
|
| [17] |
Kan D P, Jia C X. Difference analysis between radiation sensitivity test based on mixed wave chamber and anechoic chamber related test[C]//Virtual Test and Total Comprehensive Test Verification Technology. 2011(2): 61-64.
|
| [18] |
Wei G H, Liu X Y, Sun Y W, et al. Research on Correlation of Electromagnetic Radiation Susceptibility for Radio Fuze in Uniform Field and Reverberation Chamber [J]. High Voltage Engineering, 2015(41): [287-293].
https://doi.org/10.13336/j.1003-6520.hve.2015.01.040
|
| [19] |
Wang R S. Immunity test technology based on mixed wave chamber method[D]. Nanjing: Southeast University, 2015.
https://doi.org/10.7666/d.Y2977068
|
| [20] |
Peng Z Q, Zhou X. Analysis of the Relation of Radiated Immunity Tests between Reverberation Chamber and Anechoic Chamber[D]. Nanjing: Southeast University, China, 2017.
|
Cite This Article
-
APA Style
Weiguo, W., Congyi, W., Erwei, C. (2025). Equivalent Analysis of Equipment Sensitivity Thresholds Under Plane Wave Irradiation Conditions in Reverberation Chamber. Journal of Electrical and Electronic Engineering, 13(6), 267-277. https://doi.org/10.11648/j.jeee.20251306.13
 Copy
|
Copy
|
 Download
ACS Style
Weiguo, W.; Congyi, W.; Erwei, C. Equivalent Analysis of Equipment Sensitivity Thresholds Under Plane Wave Irradiation Conditions in Reverberation Chamber. J. Electr. Electron. Eng. 2025, 13(6), 267-277. doi: 10.11648/j.jeee.20251306.13
Copy
|
Download
AMA Style
Weiguo W, Congyi W, Erwei C. Equivalent Analysis of Equipment Sensitivity Thresholds Under Plane Wave Irradiation Conditions in Reverberation Chamber. J Electr Electron Eng. 2025;13(6):267-277. doi: 10.11648/j.jeee.20251306.13
Copy
|
Download
-
@article{10.11648/j.jeee.20251306.13,
  author = {Wang Weiguo and Wang Congyi and Cheng Erwei},
  title = {Equivalent Analysis of Equipment Sensitivity Thresholds Under Plane Wave Irradiation Conditions in Reverberation Chamber},
  journal = {Journal of Electrical and Electronic Engineering},
  volume = {13},
  number = {6},
  pages = {267-277},
  doi = {10.11648/j.jeee.20251306.13},
  url = {https://doi.org/10.11648/j.jeee.20251306.13},
  eprint = {https://article.sciencepublishinggroup.com/pdf/10.11648.j.jeee.20251306.13},
  abstract = {Reverberation chamber (RC) is a new testing environment in the field of electromagnetic compatibility measurement. Compared with the traditional testing environments, the RC has obvious advantages in improving testing efficiency and generating high E-field strength with relatively low input power. However, there are inconsistent problems in the test results of the radiation sensitivity threshold of the equipment in the reverberation chamber and the uniform field environment obtained by using the test methods in the current standards. Therefore, studying the equivalence of radiation sensitivity thresholds between the two has become a hot issue at present. Since most frequency-using devices in the electromagnetic environment can be equivalent to an antenna, in this paper, the dipole antenna under the compound field of the boundary deformation reverberation chamber and the uniform field of the anechoic chamber (AC) is taken as the research object to study the equivalence of antenna coupling power under these two conditions. Firstly, the coupling models in the anechoic chamber and reverberation chamber environments were established. The formulas for the antenna coupling power and the spatial radiation field strength under different radiation conditions were derived, and the power correlation coefficients of the two under the same sensitivity threshold were obtained. Subsequently, the electromagnetic environment of the reverberation chamber was constructed by using the Monte Carlo method, and the influence law of random plane waves with different column numbers on the coupling power of the antenna was simulated and analyzed. Finally, the equivalence factor of the coupling power of the two when the threshold of the radiation sensitivity test is the same in the reverberation chamber and the anechoic chamber is obtained.},
 year = {2025}
}
Copy
|
Download
-
TY  - JOUR
T1  - Equivalent Analysis of Equipment Sensitivity Thresholds Under Plane Wave Irradiation Conditions in Reverberation Chamber
AU  - Wang Weiguo
AU  - Wang Congyi
AU  - Cheng Erwei
Y1  - 2025/12/11
PY  - 2025
N1  - https://doi.org/10.11648/j.jeee.20251306.13
DO  - 10.11648/j.jeee.20251306.13
T2  - Journal of Electrical and Electronic Engineering
JF  - Journal of Electrical and Electronic Engineering
JO  - Journal of Electrical and Electronic Engineering
SP  - 267
EP  - 277
PB  - Science Publishing Group
SN  - 2329-1605
UR  - https://doi.org/10.11648/j.jeee.20251306.13
AB  - Reverberation chamber (RC) is a new testing environment in the field of electromagnetic compatibility measurement. Compared with the traditional testing environments, the RC has obvious advantages in improving testing efficiency and generating high E-field strength with relatively low input power. However, there are inconsistent problems in the test results of the radiation sensitivity threshold of the equipment in the reverberation chamber and the uniform field environment obtained by using the test methods in the current standards. Therefore, studying the equivalence of radiation sensitivity thresholds between the two has become a hot issue at present. Since most frequency-using devices in the electromagnetic environment can be equivalent to an antenna, in this paper, the dipole antenna under the compound field of the boundary deformation reverberation chamber and the uniform field of the anechoic chamber (AC) is taken as the research object to study the equivalence of antenna coupling power under these two conditions. Firstly, the coupling models in the anechoic chamber and reverberation chamber environments were established. The formulas for the antenna coupling power and the spatial radiation field strength under different radiation conditions were derived, and the power correlation coefficients of the two under the same sensitivity threshold were obtained. Subsequently, the electromagnetic environment of the reverberation chamber was constructed by using the Monte Carlo method, and the influence law of random plane waves with different column numbers on the coupling power of the antenna was simulated and analyzed. Finally, the equivalence factor of the coupling power of the two when the threshold of the radiation sensitivity test is the same in the reverberation chamber and the anechoic chamber is obtained.
VL  - 13
IS  - 6
ER  -
Copy
|
Download